How to Improve Core Web Vitals: Complete Guide
If your website feels slow, jumpy, or unresponsive, you’re not just annoying your visitors — you’re likely hurting your search rankings too.
Google now uses page experience signals to judge how good a website feels to use, and these signals have a name:
Core Web Vitals. This guide walks you through exactly what they are, how to measure them, and — most importantly — how to improve Core Web Vitals on your own site, step by step.
You don’t need to be a developer to follow along. We’ll break down each metric in plain English, show you the tools Google itself recommends, and give you practical fixes you can apply today. By the end, you’ll know exactly where your site stands and what to do next.

What Are Core Web Vitals?
Core Web Vitals are a set of measurable signals that describe how a real person experiences your website.
Instead of guessing whether a page “feels fast,” Google turned that feeling into numbers you can track and improve.
These metrics focus on three things people notice immediately: how quickly content appears, how fast the page responds when they click something, and whether elements jump around while they’re trying to read.
Google introduced Core Web Vitals as part of a broader push toward better page experience. The idea is simple — a fast, stable, responsive site keeps visitors around longer, and a slow, glitchy one drives them away.
That’s why these metrics matter to anyone running a website, not just to SEO specialists chasing rankings.
What Are Google’s Core Web Vitals?
Google’s Core Web Vitals currently measure three specific aspects of user experience: loading performance, interactivity, and visual stability.
Each one maps to a metric — Largest Contentful Paint for loading, Interaction to Next Paint for responsiveness, and Cumulative Layout Shift for stability.
Together, they give you a snapshot of how your page actually behaves for the people using it, not just how fast it loads on paper.
Why Core Web Vitals Matter for SEO and User Experience
Search engines want to send people to pages that won’t frustrate them, so page experience has become part of how Google evaluates a site’s quality.
A page that loads fast and doesn’t jump around simply keeps visitors happier, and happier visitors tend to stick around, click more, and convert better.
In fact, poor scores can quietly chip away at both your rankings and your bounce rate, even if your content is genuinely excellent.
Core Web Vitals Ranking Factors Explained
Core Web Vitals are part of Google’s page experience signals, which sit alongside things like mobile-friendliness and safe browsing.
They aren’t the single biggest ranking factor — great content still matters more — but they can act as a tiebreaker between similar pages.
If two competitors write equally strong articles, the one with better website performance often edges ahead. That’s why treating website speed optimization as an afterthought is a mistake.
The Three Core Web Vitals Metrics Explained
Each Core Web Vitals metric captures a different piece of the user experience puzzle, and Google scores them independently before rolling them into an overall page experience assessment.
Understanding what each one measures makes it much easier to diagnose problems and prioritize fixes, rather than randomly tweaking settings and hoping something improves.
Below, we’ll break down LCP, INP, and CLS individually, plus explain why FID — the metric INP replaced — is no longer part of the equation.
Largest Contentful Paint (LCP)
Largest Contentful Paint measures how long it takes for the biggest visible element on your page — usually a hero image, banner, or block of text — to fully render.
A good LCP score is 2.5 seconds or faster. If your hero image takes five seconds to appear, visitors are staring at a blank screen wondering if the site even works, which is exactly the kind of loading performance issue that pushes people to hit the back button.
Interaction to Next Paint (INP)
Interaction to Next Paint tracks how quickly your page responds after someone clicks, taps, or types. Unlike its predecessor, INP looks at responsiveness throughout the entire visit, not just the very first interaction.
A snappy INP score means buttons feel instant; a sluggish one means visitors click and then just… wait, unsure if anything happened at all.
Cumulative Layout Shift (CLS)
Cumulative Layout Shift measures visual stability — specifically, how much content unexpectedly moves around while the page loads. You’ve probably experienced this yourself:
you go to tap a button, and an ad loads above it at the last second, so you end up clicking the wrong thing. That’s a layout shift, and CLS quantifies exactly how disruptive those jumps are across the page.
What Happened to First Input Delay (FID)?
First Input Delay used to be one of the original three Core Web Vitals, but Google officially replaced it with INP in March 2024.
FID only measured the delay before a page’s very first interaction, which turned out to be a fairly narrow view of responsiveness.
INP paints a fuller picture by tracking interactions across the whole session, giving site owners a more accurate sense of how the page actually behaves.
How to Measure Core Web Vitals
You can’t fix what you don’t measure, and thankfully Google provides several free tools that report on Core Web Vitals metrics from different angles.
Some use real visitor data, while others simulate a page load in a controlled lab environment — and the difference between the two matters more than most people realize.
Let’s walk through the main tools you’ll want in your toolkit, starting with the one most people reach for first.
Google PageSpeed Insights
PageSpeed Insights is usually the first stop for checking Core Web Vitals, because it’s free, fast, and combines both real-world and simulated data in one report.
Just plug in a URL, and it’ll show you field data from actual visitors (when available) alongside a lab-based Lighthouse audit.
It also lists specific opportunities for improvement, which makes it a genuinely useful starting point even if you’re not technical.
Google Search Console Core Web Vitals Report
The Core Web Vitals report inside Google Search Console shows you how your entire site is performing, grouped by URL and by issue type.
This is where you’ll spot patterns — maybe every product page on your WooCommerce store has poor CLS, for example.
Because it uses aggregated field data, it reflects what real visitors experienced, which makes it one of the most reliable sources for prioritizing fixes.
Lighthouse
Lighthouse is an open-source auditing tool built into Chrome DevTools that generates a detailed performance report for any page.
It doesn’t just score your Core Web Vitals metrics — it explains exactly why a page is slow, down to specific scripts and images causing delays.
Developers rely on it heavily because the recommendations are actionable, not just diagnostic.
Chrome DevTools
Chrome DevTools gives you a deeper, more technical look at what’s happening as your page loads, including a Performance panel that visualizes rendering, scripting, and painting in real time.
It’s more involved than PageSpeed Insights, but if you want to see exactly which JavaScript file is blocking the main thread, this is where you’ll find it. It’s a favorite among developers doing hands-on optimization work.
Chrome Web Vitals Extension
The Web Vitals Chrome Extension adds a small badge to your browser toolbar that shows live LCP, INP, and CLS scores as you browse any page.
It’s a lightweight way to spot problems on the fly, without running a full audit every time. Many site owners keep it installed just to sanity-check pages during everyday browsing.
Field Data vs. Lab Data
Field data comes from real visitors using your site in real-world conditions, while lab data comes from a simulated test run in a controlled environment.
Field data — sometimes called Real User Monitoring, or RUM — reflects actual device speeds and network conditions, which is why Google weighs it heavily for ranking purposes.
Lab data, on the other hand, is more consistent and easier to debug because you control every variable, making it ideal for testing fixes before they go live.
How to Improve Core Web Vitals
Now for the part you actually came here for: how to improve Core Web Vitals in practice.
Most fixes fall into a handful of categories — hosting, caching, images, code, and mobile performance — and you rarely need to tackle all of them at once.
Start with whichever metric is scoring worst in Search Console, then work through the fixes below in that area first.
The good news is that these improvements compound. Fixing render-blocking resources often helps both LCP and INP, and optimizing images helps LCP while also reducing overall page weight. Let’s go through the levers you can pull, one at a time.
Upgrade to Faster Web Hosting
Cheap shared hosting is often the root cause of poor Core Web Vitals, because your site is competing with hundreds of others for the same limited server resources.
Moving to a quality host — ideally one optimized for your platform, like managed WordPress hosting — can shave real seconds off your load times without touching a single line of code. If you’ve optimized everything else and scores are still poor, hosting is usually the missing piece.
Improve Server Response Time (TTFB)
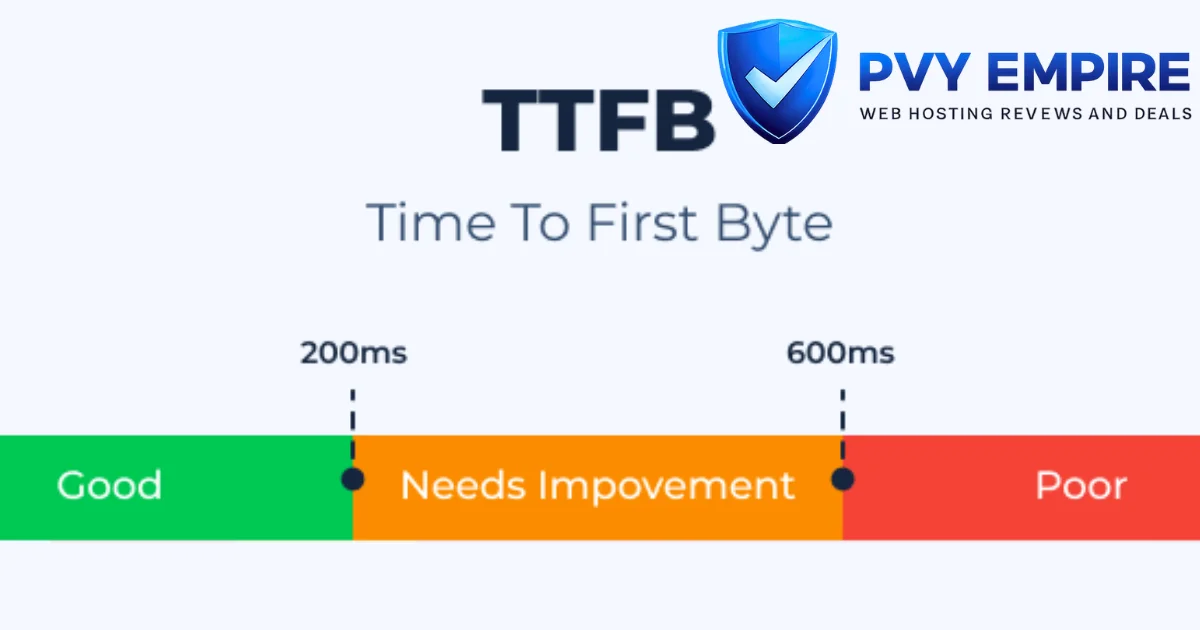
Time to First Byte measures how long the server takes to start sending data after a request comes in, and a slow TTFB delays everything downstream, including LCP.
Common culprits include unoptimized databases, bloated server-side code, and hosting that’s simply underpowered for your traffic. Reducing server response time often requires backend tuning, but the payoff shows up across nearly every other metric.
Enable Page Caching
Page caching stores a ready-to-serve version of your page so the server doesn’t have to rebuild it from scratch on every visit.
This is one of the fastest wins available, especially for content-heavy or WordPress sites, because it can cut load times dramatically with minimal setup.
Most caching plugins or built-in host-level caching can be turned on in a few clicks.
Use a CDN
A content delivery network stores copies of your site on servers around the world, so visitors load files from a location near them instead of one central server far away.
This reduces latency significantly for global audiences and takes pressure off your origin server. Services like Cloudflare also bundle in extras like edge caching and HTTP/3 support, which add further speed gains.
Optimize Images and Next-Gen Formats
Images are frequently the single biggest contributor to a slow LCP, so image optimization should be near the top of your list.
Converting images to next-gen formats like WebP typically cuts file size significantly without a visible drop in quality, and proper image compression shrinks things further.
Don’t overlook resizing images to their actual display dimensions, either — serving a 4000px image into a 400px container wastes bandwidth for no visual benefit.
Lazy Load Images and Videos
Lazy loading defers offscreen images and videos until the visitor actually scrolls near them, which means the browser doesn’t waste time loading content nobody’s seen yet.
This speeds up initial page load considerably, particularly on image-heavy pages. Just be careful not to lazy load your hero image, since that one needs to appear immediately for a good LCP score.
Minify CSS, JavaScript, and HTML
Minification strips out unnecessary characters, whitespace, and comments from your code without changing how it functions.
It sounds small, but on a site with dozens of CSS and JavaScript files, HTML minification and its counterparts can meaningfully reduce total page weight.
Most caching and optimization plugins handle this automatically once enabled.
Remove Unused CSS and JavaScript
Many websites — especially ones built with page builders or loaded with plugins — ship far more CSS and JavaScript than any given page actually needs.
Unused CSS and unused JavaScript still have to be downloaded and parsed by the browser, slowing everything down for no reason.
Auditing your site and trimming this dead weight is one of the more technical fixes here, but it can produce a noticeable INP improvement.
Eliminate Render-Blocking Resources
Render-blocking resources are scripts and stylesheets that stop the browser from displaying anything until they’ve fully loaded.
Deferring non-critical JavaScript and loading it asynchronously lets the browser paint visible content first and handle the rest afterward.
This directly targets your critical rendering path and can produce a fast, visible improvement in perceived loading speed.
Optimize Fonts
Web fonts can silently slow down text rendering, especially when they’re loaded from a third party or block the page until they arrive.
Using font-display: swap lets the browser show fallback text immediately, then swap in your custom font once it’s ready, avoiding invisible text while the page loads.
Self-hosting your fonts instead of pulling them from an external server also shaves off a few precious milliseconds.
Reduce Third-Party Scripts
Every third-party script you add — analytics tools, chat widgets, ad networks, tracking pixels — adds its own loading and execution time, often on servers you don’t control.
Auditing your site periodically and removing anything that isn’t earning its keep is an easy way to reclaim performance. If a script is essential, consider loading it asynchronously so it doesn’t block the rest of the page.
Limit Heavy Plugins
On platforms like WordPress, plugins are a common and often-overlooked source of bloat. Each one adds its own CSS, JavaScript, and sometimes database queries, and a site running thirty plugins is almost always going to feel sluggish.
Regularly reviewing your plugin list and removing anything redundant or rarely used is a simple habit that pays off in speed.
Choose a Lightweight Theme
Heavy, feature-packed themes often load resources you’ll never actually use, which drags down every metric before you’ve even added your own content.
A lightweight theme, by contrast, gives you a clean foundation to build on without the extra baggage.
If you’re starting a new site or considering a redesign, this is worth factoring in from day one.
Optimize for Mobile Performance
Since Google uses mobile-first indexing, your mobile performance often matters more for rankings than your desktop performance does.
Mobile devices typically have less processing power and slower networks, so issues that are barely noticeable on desktop can become glaring on a phone.
Testing your site specifically on mobile — not just assuming desktop results translate — is essential for accurate Core Web Vitals optimization.
How to Improve Largest Contentful Paint (LCP)
LCP problems almost always trace back to one of a few root causes: a slow server, an oversized hero image, or resources blocking the browser from rendering quickly.
The fixes below target those causes directly and tend to produce some of the most visible improvements you’ll see in PageSpeed Insights.
Work through these roughly in order, since server and rendering issues tend to have the biggest downstream impact on your LCP score.
Optimize Hero Images
Your hero image is usually the element responsible for your LCP score, so it deserves special attention beyond general image optimization.
Compress it, serve it in a next-gen format, and make sure it’s sized appropriately for the display area rather than scaled down by the browser.
Skipping lazy loading specifically for this image also ensures it starts loading the moment the page opens.
Improve Server Performance
A slow server delays everything that follows, including how quickly your largest element can even begin loading.
Look at database query efficiency, server-side caching, and whether your hosting plan can realistically handle your traffic. Sometimes the simplest fix is also the most effective: better hosting, full stop.
Preload Important Resources
Preloading tells the browser, “fetch this resource early, because I already know I’ll need it.”
Applying this to your hero image or a critical font file gives the browser a head start instead of discovering that resource late in the loading process. It’s a small line of code with an outsized effect on perceived speed.
Reduce Render Blocking
Just as with the general Core Web Vitals fixes above, cutting down render-blocking resources helps your LCP specifically because it lets the browser reach and paint that largest element sooner.
Deferring scripts that aren’t needed for the initial view keeps the rendering path clear. The less the browser has to process before painting, the faster that hero content appears.
How to Improve Interaction to Next Paint (INP)
A poor INP score usually means the browser’s main thread is too busy to respond quickly when someone interacts with your page.
That congestion typically comes from heavy JavaScript execution, and the fixes here focus on lightening that load and keeping the page responsive at all times.
These fixes tend to be more developer-focused than image or hosting tweaks, but they’re worth understanding even if you’re handing the work off to someone else.
Reduce JavaScript Execution Time
Every script that runs on your page takes up processing time, and the more of it there is, the longer the browser stays too busy to respond to clicks.
Auditing your JavaScript optimization opportunities — removing unused libraries, combining redundant scripts — directly frees up that processing time. This is often the single biggest lever for improving INP.
Break Up Long Tasks
When a script runs for too long without pausing, it blocks the browser from handling anything else, including user input.
Breaking long-running JavaScript into smaller chunks lets the browser interject and respond to interactions in between, which keeps the page feeling responsive even while background work continues. Developers often call this “yielding to the main thread.”
Optimize Event Handlers
Poorly written event handlers — the code that runs when someone clicks, scrolls, or types — can add unnecessary delay to every interaction.
Keeping these handlers lean and avoiding expensive operations inside them (like layout recalculations) keeps responses snappy. Small inefficiencies here add up fast on interaction-heavy pages.
Improve Browser Responsiveness
Beyond individual scripts, overall browser responsiveness benefits from reducing the total amount of work happening at once.
This means combining several of the fixes above: less JavaScript, shorter tasks, and leaner event handling all working together. The goal is a page that never makes the visitor wonder if their click registered.
How to Improve Cumulative Layout Shift (CLS)
CLS problems come from content moving after it’s already visible, and the fixes are largely about giving the browser enough information upfront to reserve space correctly.
These are some of the easiest Core Web Vitals fixes to implement, and they often produce immediate, measurable results.
Let’s go through the most common causes and how to eliminate each one.
Set Image and Video Dimensions
If you don’t specify width and height attributes on images and videos, the browser doesn’t know how much space to reserve before the file finishes loading — so it shifts everything else once the actual size becomes known.
Explicitly setting these dimensions lets the browser allocate space immediately, preventing that jarring jump entirely. It’s a simple fix with an outsized impact on visual stability.
Reserve Space for Ads and Embeds
Ads and third-party embeds are notorious for causing layout shifts, since they often load after the surrounding content and push everything downward.
Reserving a fixed-size container for these elements in advance stops that disruption before it happens. This is especially important on content sites and blogs that rely on ad revenue.
Optimize Font Loading
Custom fonts can cause a layout shift when the fallback font and the final font take up different amounts of space, a phenomenon sometimes called flash of invisible text.
Using font-display: swap alongside closely matched fallback fonts minimizes the visual jump when the real font finally loads. Font optimization here overlaps directly with the LCP fixes discussed earlier.
Prevent Dynamic Content Shifts
Dynamically injected content — like a cookie banner, a promotional bar, or a late-loading widget — can push the entire page down after the visitor has already started reading.
Reserving space for these elements ahead of time, or inserting them in a way that doesn’t displace existing content, avoids the disruption. This is a common but often-overlooked source of poor CLS scores.
Common Core Web Vitals Mistakes to Avoid
Even well-intentioned optimization efforts can go wrong if you’re fixing the wrong things or introducing new problems while solving old ones.
Knowing what commonly derails Core Web Vitals scores helps you avoid wasting time on ineffective changes.
Here are the mistakes we see most often, and why they matter more than they might seem to at first glance.
Using Too Many Plugins
It’s tempting to solve every small need with another plugin, but each one adds weight, and conflicts between plugins can create performance issues that are hard to diagnose.
A leaner plugin stack is almost always faster and more stable than a bloated one. When in doubt, ask whether a plugin’s functionality could be handled more efficiently with custom code instead.
Unoptimized Images
Uploading full-resolution images straight from a camera or design tool, without compressing or resizing them, remains one of the most common — and easily avoidable — performance mistakes.
It directly hurts LCP and inflates total page size for no real benefit. A quick pass through an image compression tool before uploading solves this almost entirely.
Excessive JavaScript
Piling on tracking scripts, animation libraries, and interactive widgets without considering their cumulative cost is a fast way to tank your INP score.
Every script adds parsing and execution time, and it adds up quickly across a typical page. Regularly auditing what’s actually necessary keeps this under control.
Poor Hosting
No amount of front-end optimization can fully compensate for a server that’s simply too slow or overloaded.
If your TTFB is consistently poor despite doing everything else right, hosting is very likely the bottleneck. It’s worth treating as a foundational fix rather than a last resort.
Ignoring Mobile Performance
Many site owners test exclusively on desktop, where fast home Wi-Fi and powerful hardware mask problems that mobile visitors experience constantly.
Given mobile-first indexing, this is backwards — your mobile performance should be the priority, not an afterthought. Always test on throttled mobile conditions to see what real users actually encounter.
Best Tools to Monitor Core Web Vitals
Ongoing performance monitoring matters just as much as the initial fixes, since site changes, new plugins, or added content can quietly reintroduce problems over time.
Checking in regularly with the right tools helps you catch regressions before they affect your rankings.
Here’s a rundown of the tools worth having in your regular monitoring routine.
Google PageSpeed Insights
As covered earlier, PageSpeed Insights remains the fastest way to get both field and lab data on a specific URL.
It’s worth bookmarking and checking after any significant site update. Because it’s free and requires no setup, there’s really no reason not to use it regularly.
Google Search Console
Search Console’s Core Web Vitals report gives you a site-wide view rather than a single-page snapshot, making it ideal for spotting patterns across templates or page types.
Since it uses real user data collected over time, it’s less prone to one-off fluctuations than a single lab test. Check it monthly at minimum, especially after major content or design changes.
Lighthouse
Lighthouse remains one of the most detailed diagnostic tools available, and it’s built directly into Chrome DevTools, so there’s nothing extra to install.
It’s particularly useful when you need specific, developer-ready recommendations rather than just a score. Run it before and after any optimization to confirm the change actually helped.
GTmetrix
GTmetrix offers a detailed performance breakdown similar to Lighthouse, with the added benefit of historical tracking so you can watch trends over time.
It also lets you test from different global server locations, which is handy if your audience is spread across regions.
Many site owners find its visual waterfall charts easier to interpret than raw Lighthouse output.
WebPageTest
WebPageTest is a favorite among more technical users because it allows granular control over test conditions — device type, connection speed, browser, and location.
It produces an extremely detailed report, including a filmstrip view showing exactly how your page rendered frame by frame. It’s a bit more advanced, but incredibly useful for diagnosing stubborn performance issues.
Core Web Vitals Best Practices for WordPress
WordPress powers a huge share of the web, and its plugin-and-theme ecosystem makes it especially prone to Core Web Vitals problems if left unmanaged.
The good news is that a handful of WordPress-specific practices can address most common issues without needing custom development.
If your site runs on WordPress, these are the areas worth focusing on first.
Use LiteSpeed Cache or WP Rocket
A quality caching plugin is one of the highest-leverage changes you can make on WordPress, and both LiteSpeed Cache and WP Rocket handle page caching, minification, and lazy loading in one package.
They’re relatively easy to configure even without deep technical knowledge. For most sites, installing one of these is the single biggest speed win available.
Optimize WooCommerce Performance
WooCommerce stores tend to be heavier than typical WordPress sites because of product images, cart functionality, and various e-commerce plugins running simultaneously.
Focusing on image optimization for product photos, limiting unnecessary extensions, and using a host built for WooCommerce specifically can make a substantial difference.
Cart and checkout pages deserve particular attention, since layout shifts there directly affect conversions.
Keep Themes and Plugins Updated
Outdated themes and plugins sometimes ship inefficient code that gets fixed in later versions, so staying current isn’t just about security — it’s about performance too.
Developers frequently optimize their code over time as best practices evolve. Set a regular schedule to review and update everything running on your site.
Use a Reliable CDN
Pairing WordPress with a CDN like Cloudflare adds edge caching, image optimization, and sometimes even automatic minification, all without touching your site’s code directly.
This is particularly valuable for sites with visitors spread across different regions or countries. It’s one of the easiest infrastructure upgrades to implement and tends to deliver a fast, noticeable payoff.
Conclusion
Improving Core Web Vitals isn’t about chasing a perfect score for its own sake — it’s about giving visitors a faster, steadier, more responsive experience, which happens to align nicely with what Google wants to rank.
Start by measuring where you currently stand using PageSpeed Insights and Search Console, then tackle whichever metric is weakest first.
Small, consistent fixes — better hosting, smarter caching, optimized images, leaner code — add up to real, measurable gains over time.
You don’t need to fix everything overnight. Prioritize the changes that address your worst-performing metric, monitor your progress regularly, and treat performance as an ongoing habit rather than a one-time project.
Do that, and both your visitors and your rankings will notice the difference.
FAQs
What are Core Web Vitals?
They’re a set of Google metrics — LCP, INP, and CLS — that measure loading speed, responsiveness, and visual stability on your site.
Do Core Web Vitals affect SEO?
Yes, it’s part of Google’s page experience signals, though strong content still matters more for rankings overall.
What is a good Core Web Vitals score?
Generally, an LCP under 2.5 seconds, an INP under 200 milliseconds, and a CLS under 0.1 are considered good.
What replaced First Input Delay?
Interaction to Next Paint (INP) officially replaced FID as a Core Web Vitals metric in March 2024.
Which tool measures Core Web Vitals best?
Google Search Console and PageSpeed Insights are the most reliable, since they combine or reference real-user field data.
How long does it take to improve Core Web Vitals?
Some fixes, like enabling caching, show results immediately, while others, like server or hosting changes, may take a few weeks to fully reflect in Search Console.
Which plugins improve Core Web Vitals on WordPress?
Caching plugins like WP Rocket or LiteSpeed Cache, combined with image optimization tools, typically deliver the biggest improvements.
Related Posts
- How to Fix Hostinger Slow WordPress Sites?
- 20 PHP Hosting Providers for Fast Website Performance
- WordPress Speed Optimization: Complete Guide
- How to Speed Up WordPress Site Step by Step
- How to Reduce TTFB: 12 Proven Ways to Improve Server Response Time
- 14 Best WordPress Cache Plugins to Speed Up Your Website
- Cloudflare Setup Guide: How to Set Up Your Website Step by Step
- How to Set Up QUIC Cloud for WordPress (Step-by-Step Guide)
- WooCommerce Checkout Slow? Advanced Fixes That Work
- LiteSpeed Cache for WordPress (Complete Guide)
- How to Fix Bluehost Slow WordPress Websites?

Alex Bryant is the founder of PvyEmpire.com and a WordPress specialist with over 4 years of hands-on experience in web hosting, performance optimization, and website management. He has extensively tested top hosting providers by setting up real websites and monitoring their speed, uptime, and reliability.
At PvyEmpire.com, Alex publishes honest, data-driven reviews, detailed guides, and verified coupons & deals. His goal is to help website owners choose the right hosting, improve performance, and grow their online presence with confidence—based on real testing, not promotions.